


Great news: we have a new Angular browser dev extension!
Angular DevTools lives inside Chrome/Edge DevTools and provide Angular specific debugging and profiling capabilities.
\> installation link (for Chrome or Edge)
Note: we previously had the Augury extension (and even before that Batarang if you can remember…), but it was not maintained anymore since Angular 9.
This new Angular DevTools extension will work with any app using Angular v9+. Also, it will not work with app compiled in production mode.
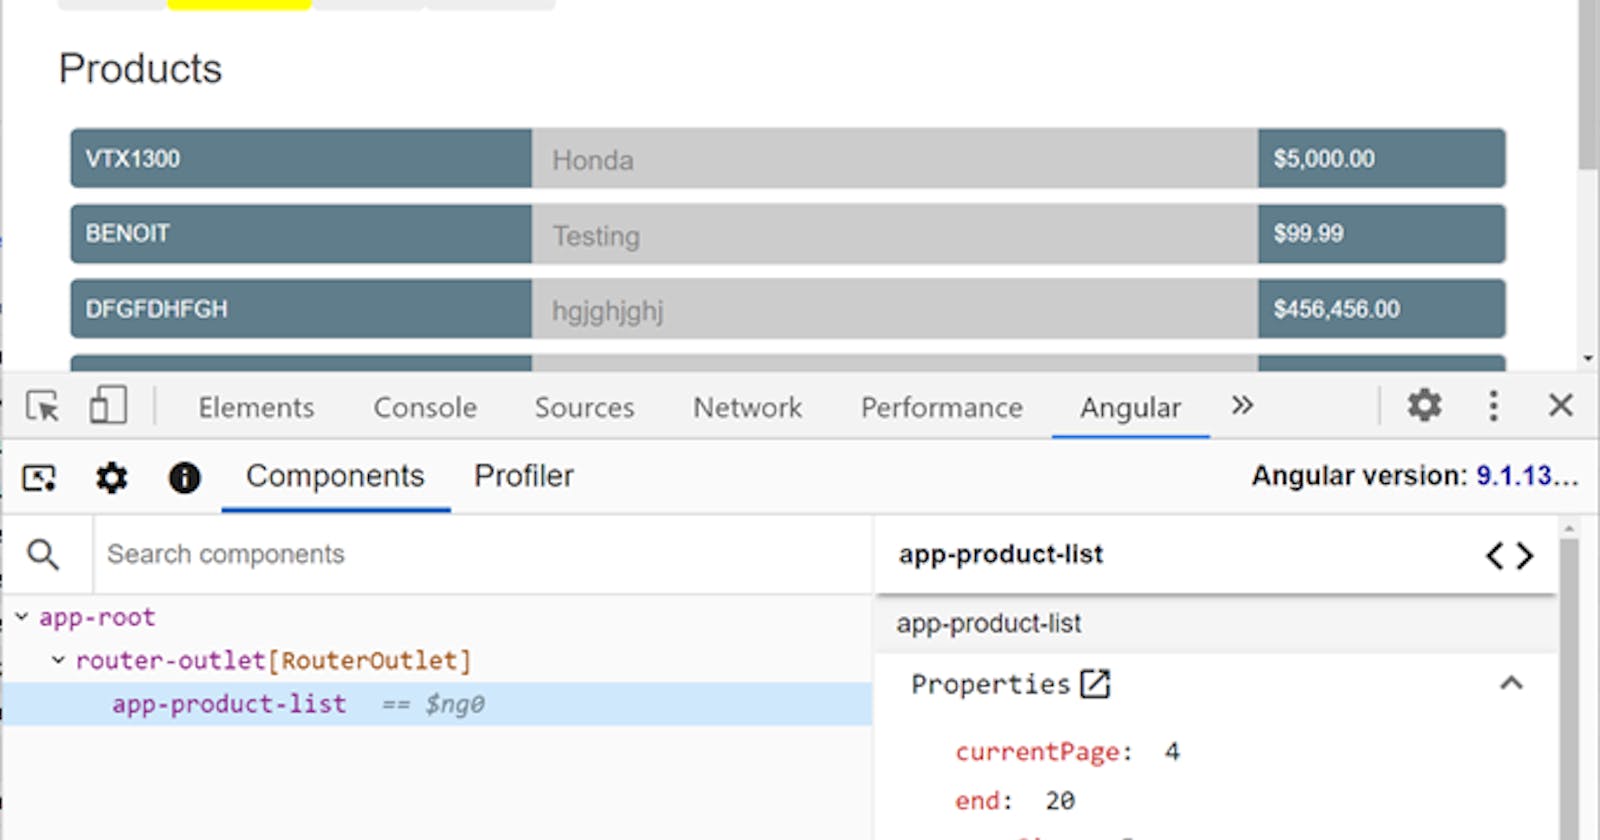
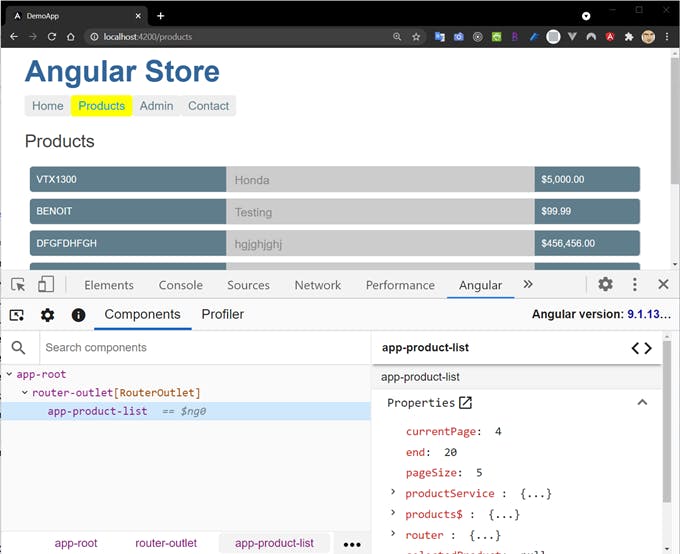
Inspect your components tree and properties
You can use Angular DevTools to understand the structure of your application and preview the state of the directive and the component instances. You can even modify values and see changes in real time!
👉 Test your Angular skills, become Certified Angular Developer! 🏆🏅
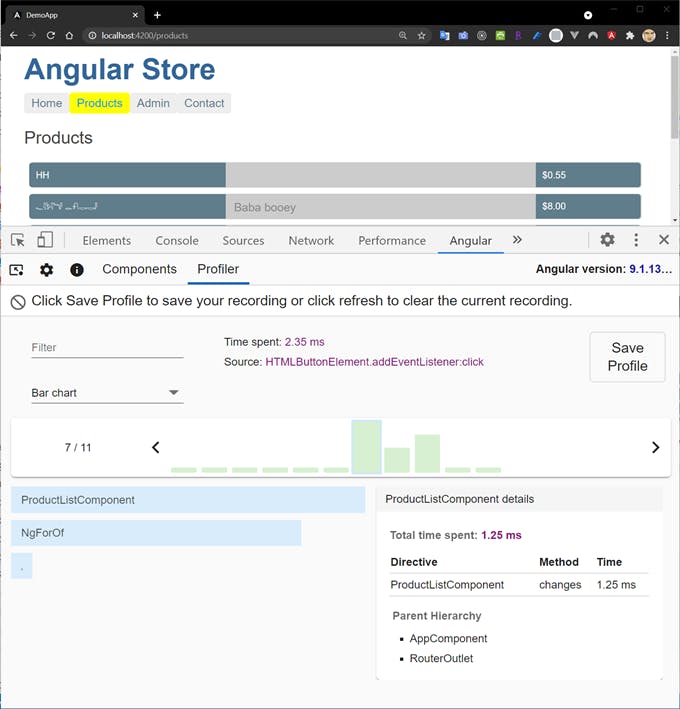
Profile your app and inspect change detection cycles!
You can use the profiler tab to get insights into the execution of the application, which shows you the individual change detection cycles, what triggered them, and how much time Angular spent in them.
That’s definitely a great tool to have and a nice addition to the Angular dev ecosystem!